Select your language
This page shows some application examples from the area of vibration measurement and vibration testing.The camera systems StrobeCAM and the Q400 DIC system are used for vibration measurements.
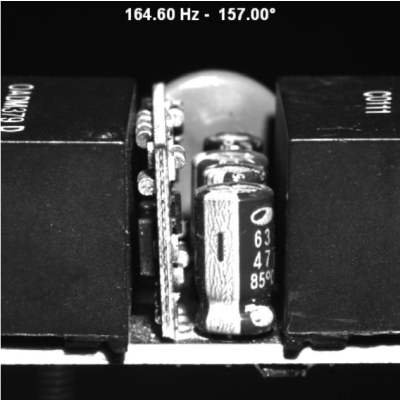
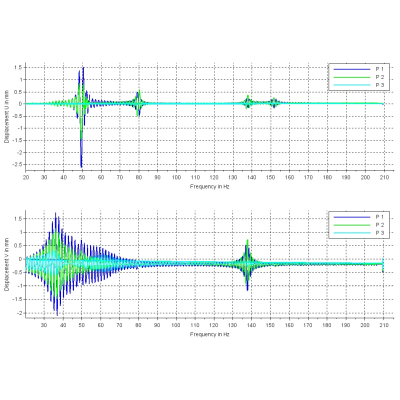
Vibration measurement of electronic components on a PCB Board
Contactless measurement of the resonance curve of a spring
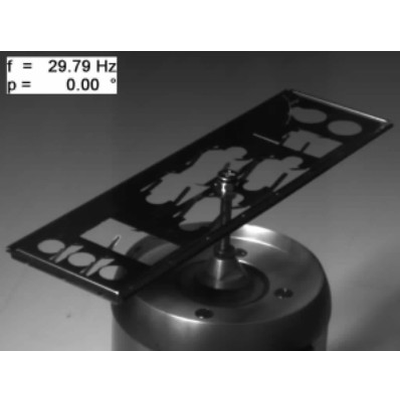
Slow motion video of a vibrating connector panel
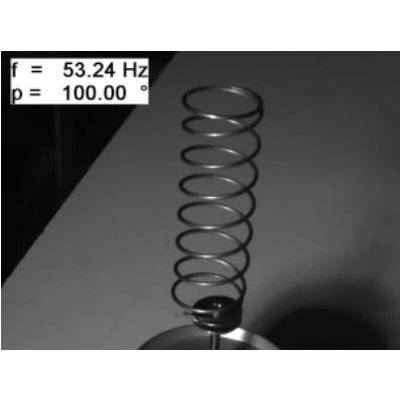
Slow motion video of a vibrating spring
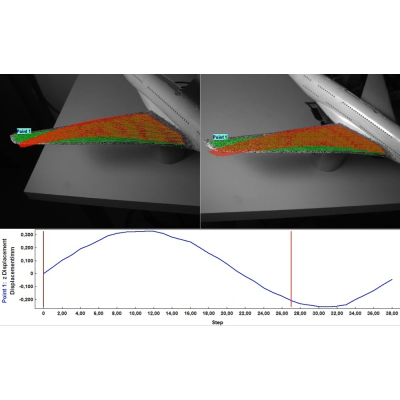
Modal shape of a wing
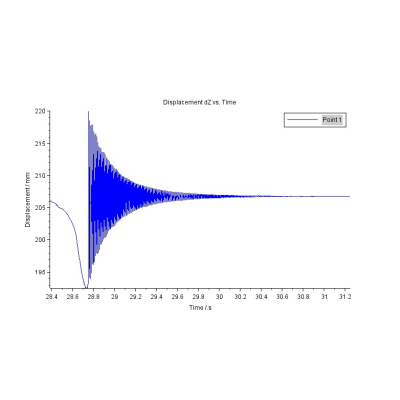
Pulse hammer test → Measurement of resonance frequency and damping
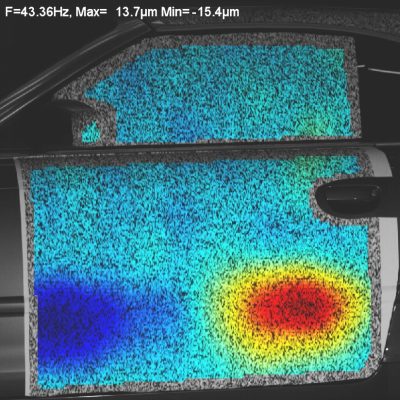
Car body vibration in wind tunnel
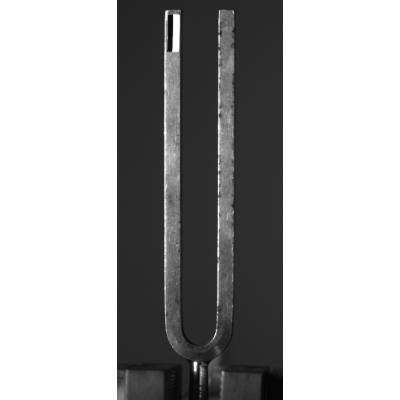
Eigen frequency of a tuning fork
Your Application not found ?
Please contact us for
Do you have questions related to ourproducts or services ?
Tel +49 (0) 2151 36528 00
To the contact form