LIMESS Logo 427x150

Select your language

3D DIGITISATION application example

Deformation Measurement of a Stone arch Bridge with laser scanner

By comparing scans of a stone arch bridge in the unloaded and loaded states, the deformation of the bridge is measured.
The laser scanner Surphaser delivers submillimeter accuracy and a measurement noise of only 24µm.

Deformation measurement using Surphaser on a stone arch bridge

Report about the deformation measurement of a stone arch bridge by using a laser scanner


The contractual behaviour of a stone arch bridge shall be determined with a load test. The train bridge is loaded with up to 6MN (600 tons) which matches 6 locomotives. 3D scans of the whole bridge underside and their supports are acquired with the laser scanner Surphaser.

The comparison of the 3D coordinates of the unloaded and loaded state measures the deformation of the bridge with sub millimiter accuracy at about 5 millions surface points. Figure 1 shows the underside of the bridge with the laserscanner Surphaser in front of the bridge. The load is applied at the shown 4 vectors.
Defomation measurement of a stone arch bridge using Laserscanner Surphaser

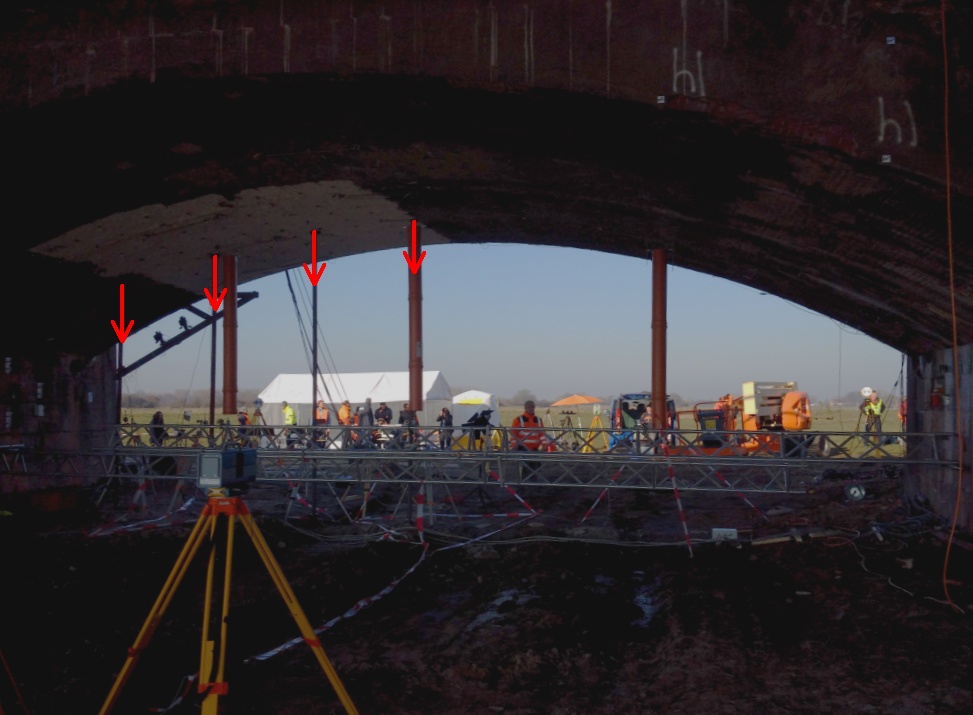
Figure 1: Laserscanner Surphaser at 3D scanning of the bridge underside.


Figure 2 shows the color scaled deformation field (top view) of the bridge at a load of 4MN. Because the load is applied only on one of the two rails and only of one half of the bridge span the deformation field is unsymmetrically. The maximal bending is about 6mm at a load of 4MN.
Top view with defomation color overlay. Measurement of a stone arch bridge using Laserscanner Surphaser.

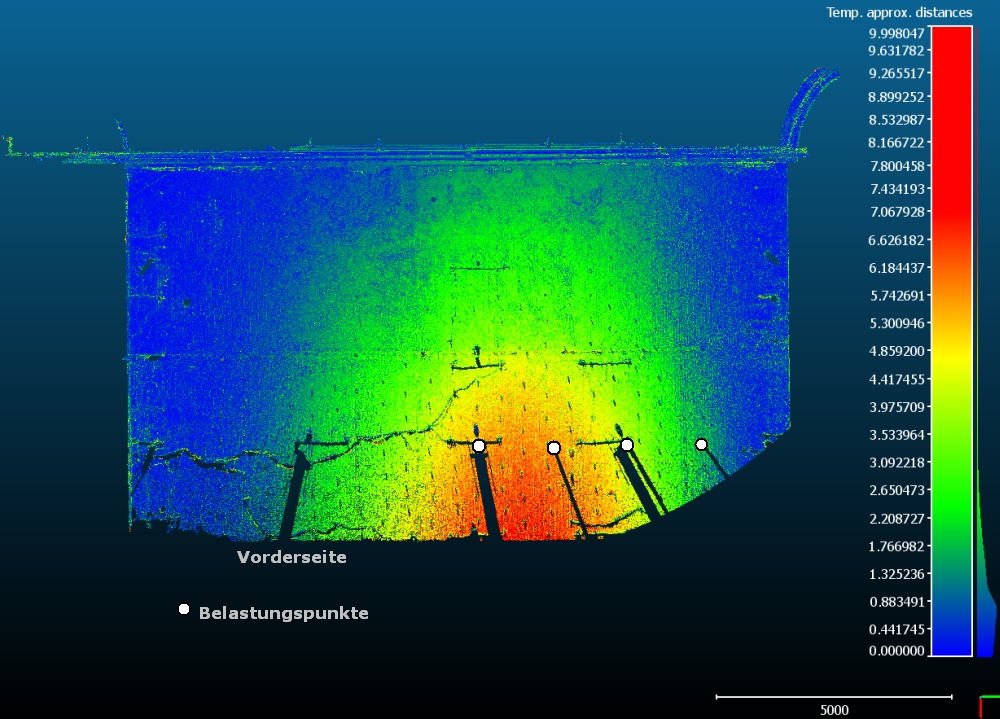
Figure 2: Color coded deformation field (top view). The color scale shows the deformation in millimeter.


A total of 20 scans have been acquired at different loads and also in unloaded states after the load application. From these scans the elastic and plastic deformation can be determined. We will be happy to supply our measurement data to the institutions and the companies which participated in this test.

Figure 3: Animation of the bridge 3D view.


Summary
• Scan device
• Number of Scans:
• Time per scan:
• Scan volume
• Points per scan:
• Point density:
• Post processing:


Surphaser HSX100-SR
20
3,5 minutes
22x22x22 m
4.5 millionen on the bridge segment
ca. 10mm bei 10m Abstand
Calculation of the point cloud difference (3 minutes per scan)

Your Application not found ?

Please contact us for

  • further examples
  • a free system demonstration
  • service measurements.

Contact

Do you have questions related to our
products or services ?

Tel +49 (0) 2151 36528 00

To the contact form

phone-symbol